March inflation is up. The CEA delivered a historic tweetstorm. It starts with
temporary factors: base effects, supply chain disruptions, and pent-up demand, especially for services
I'm glad for once to have nailed a forecast: That Fed and Administration's first response to inflation would be to invoke "temporary" factors, just as in the 1970s. We'll see how that pans out.
The CEA goes on to "base effects,"
In the near-term, we and other analysts expect to see “base-effects” in annual inflation measures. Such effects occur when the base, or initial month, of a growth rate is unusually low or high..
This unusually large price decrease early in the pandemic made April 2020 a low base.
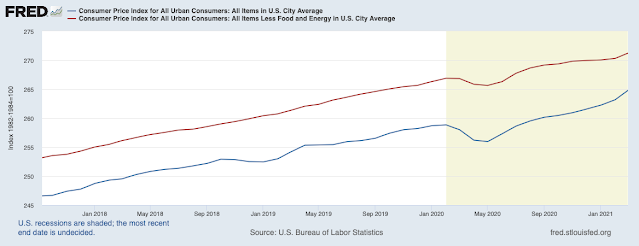
Since this is about the past, we can say something more definite. Yes, if you start from a low base, you can see a lot of growth. To get around the arbitrariness, let's look at price levels. Here is the recent CPI (blue) and CPI less food and energy (red). These are the levels of the CPI -- conceptually how many dollars it takes today ($271) to buy what $100 bought in 1983.
The last few months uptick is clearly visible. You can find your own "base month" by drawing a line. Yes, a line from last April to today shows an unusually higher slope, because last April was unusually low.
But to the extent that we're just seeing "reflation," a return of prices to normal after a steep covid-induced recession, the graph suggests that was over last summer. "Reflation" was over by September. Draw your own trends -- that's why I left some history in.
The inflation data is also seasonally adjusted. This is a big black box, involving a seven-year two-sided weighted moving average. It's one big reason data keep getting revised. For annual growth rates, it makes sense to also look at the real data:
This is non-seasonally adjusted CPI (blue) and CPI less food and energy (red). If anything the story, reflation was over last fall and this is something new is clearer. But, as 2019 reminds us in both graphs, stuff happens.
BTW, here is the CPI through the last recession
Look really hard to see the trend down in the red, core CPI, line around 2010. Befitting a recession driven by a financial crisis, not a supply-side pandemic shutdown, and prolonged (in my view) by counterproductive policies, we see the price level stay permanently below the previous trend.


Comments
Post a Comment